Leveraging automated RM&M to improve managed services and system performance.
Contributed by Sangeetha B and ennVee DBA team.
Achieving Remote Monitoring and Management
RM&M, Remote Monitoring and Management, is a core component of managed service automation. It handles tasks like alerts and troubleshooting so teams don't have to monitor systems in real time. By leveraging RMM, organizations will become more proactive and productive, improve service quality, expedite business processes, and reduce operating costs. In the long term, the time and cost savings can be reinvested into leading-edge projects and work that isn’t well-suited for machines.
Whether you use outsourced managed services or have an internal team, you need to transform how you manage enterprise systems to pursue managed service automation.
Challenges
Manual monitoring —Traditional monitoring and management are time and resource intensive.
Complex IT portfolios — As the business evolves the technology stack follows suit. Tying together all of your data and KPIs becomes more complex when you implement new systems, consolidate legacy or homegrown systems, undergo a merger or acquisition, or open a new business unit or location.
Optimize for the user — Customers have high standards when it comes to availability and agility, so providing a seamless end-user experience is crucial to the success of any organization. Organizations need to be proactive to ensure optimal performance and efficiency, and reactive to quickly diagnose and resolve issues before they impact the user. The impact of outages and downtime increases with the size of the organization, as there are incidents to address and team members are involved in identifying and resolving an issue.
To recap, the key challenges of traditional monitoring and management include:
- Lack of automation
- Time and resource intensive
- Difficult to scale
- Difficult to tie together the data and KPIs across the technology stack (SaaS, legacy, and homegrown systems)
How do we solve these gaps?
We developed a tool to overcome these challenges and disrupt the traditional way of monitoring enterprise systems. The remainder of this article explores ennVee TrendZ and how it is being used to intelligently monitor applications, databases, infrastructure, and middleware.
Automated Performance Monitoring & Management with TrendZ
ennVee's lightweight, RMM tool, TrendZ, provides intelligence based on real-time and historical data from your enterprise systems that enables DBAs, SysAdmins, support teams, IT operations, and management to make more informed decisions, and plan and forecast more proactively. TrendZ focuses on the following functional areas: Availability, Latency, Performance, Efficiency, Monitoring, and Capacity Planning.
Features
What does TrendZ monitor?
TrendZ can monitor any metric that generates a value from any business application, middleware, database, or infrastructure component.
- Business Applications: Oracle EBS, Value Chain Planning, Demantra/ASCP, Agile, Siebel, Oracle Transportation Management (OTM), Fusion Applications
- Middleware: OBIEE, Hyperion, Essbase, SOA, Oracle Identity & Access Management Suite
- Database/Infrastructure: Oracle Database, Microsoft SQL Server, MySQL, APEX, MariaDB, Oracle Cloud Infrastructure, Oracle Exadata/Engineered Systems
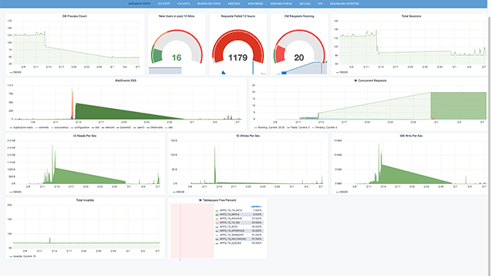
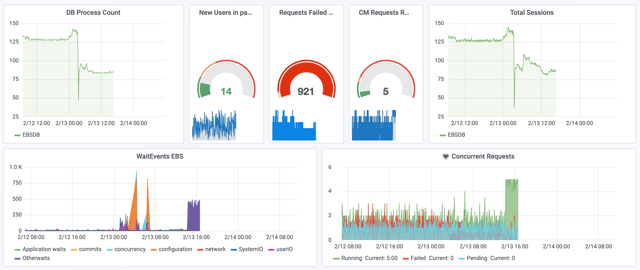
Oracle E-Business Suite (EBS)
The Oracle EBS dashboard includes database and OS stats, Workflows, R12 Web and Forms, KPIs custom to the business, CM Requests, Month-end/Period-close/Year-end processes, and an automated error log tool.
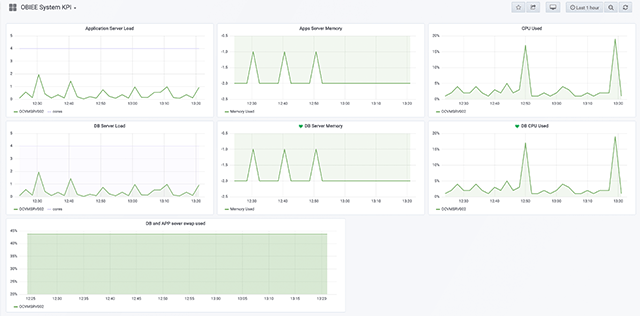
OBIEE
The OBIEE dashboard displays database and OS stats like server load, and memory and usage for JVM, WebLogic, and Tomcat.
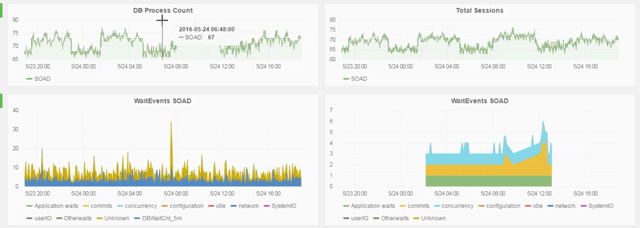
Oracle SOA
You can monitor SOA and composite applications and drill down into state count, completion time, delivery message states, the number of errors, and from where they occurred based on the state. You can also view the processing time to determine how long it takes to complete each process and whether you need to tune the composite.
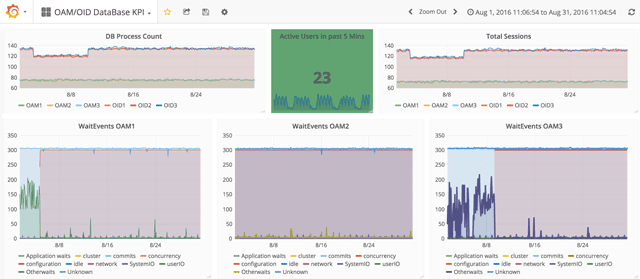
Oracle Identity & Access Management
You can view the number of users logged into OAM at a given time, trend average user count, and map user trends for the last 24 hours.
Key Features
We'll explore how TrendZ is used to monitor ERP systems, specifically Oracle E-Business Suite.
Historic Data Views
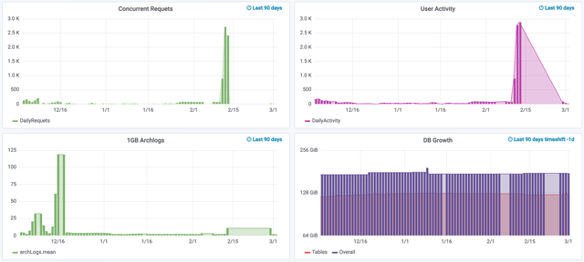
Collecting and utilizing data for prediction and analysis is critical for any application. This data can be used to support the analysis of failures and the lack of any features can add value. In TrendZ, the Historic Data Views dashboard helps you understand database growth, server utilization, and whether to invest in performance tuning or increase capacity.
Trending this data across 30, 60, or 90-day periods helps you pinpoint the root cause faster so you can proactively fix an issue.
Automated, Native Log Parser
DBAs and Admins typically need to sort through hundreds of error logs to find the one that errored. This is a manual, time-intensive task that delays their ability to resolve an issue, and one of the reasons why we automated this process.
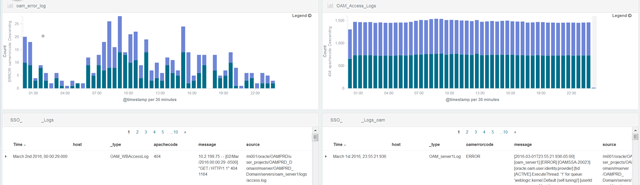
TrendZ automatically analyzes your log files for errors and displays the errored logs on a dashboard. All you need to do is provide the strings and pattern for which TrendZ should search in the log files. An alert is automatically sent when those parameters are found. You can click on the error log to view more information like server name, port, etc.
TrendZ can also be configured against any log type: application log files, JVM, Apache, WebLogic, alert logs, HTTP, Oracle Access Manager (OAM), OS logs, in addition to server log files, messages, and var logs.
Concurrent Request Monitoring
Concurrency monitoring for ERP applications is critical for any type of business. In TrendZ, the concurrency monitoring dashboard provides insight into:
- The name, number, status, and user who submitted the request
- How long each request took to complete
- Requests running in each queue
- Requests that completed during a specific period of time
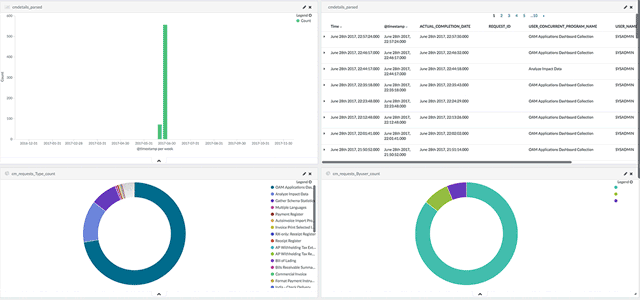
Having instant access to this information helps you determine concurrency performance and become more proactive by creating additional managers or assigning requests.
Automated Alerts
TrendZ gives you more control over predictable system breakpoints through intelligent alerts based on your own metrics. You determine the conditions and how often the alert should be checked and TrendZ automatically notifies you when those conditions are met.
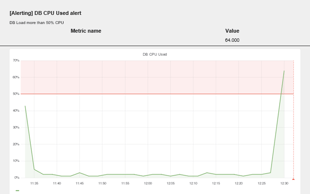
Alerts can be sent through your existing communication and incident management tools, like email, text message, service desk, etc. TrendZ can also connect to your ticketing tool and automatically open a ticket when an alert is triggered.
Month-End / Period-Close Reporting
You want to understand how KPIs and business processes that are critical to your organization are performing over time and any deviation that occurs during business cyclical events like month-end, period-close, and year-end close.
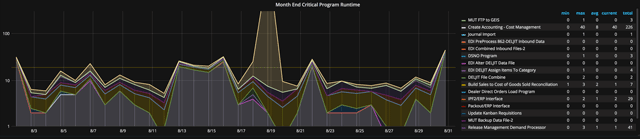
The Reporting dashboard details the minimum, maximum, average, and current amount of time it took for a program to run, which allows you to quickly and proactively spot and tune poor-performing programs.
| Shipping | Month-end (Financials, etc.) |
| Lockbox | Workflow Activities |
| Monthly Activities and Processes | Shipment Processes |
| Invoice Gen | Order Cycles |
| Key Reports/Timing for Key Reports | Enhancements |
| Alerts | Concurrent Requests Threshold |
| Pending Work Orders |
Business KPIs
Business users and management need visibility into the KPIs that impact them. For example, they may want to understand the number of failed orders over the past month, how many purchase orders or requisitions were entered into the system, and whether they were entered, pre-approved, approved, closed, or canceled.
We designed TrendZ to provide value to both the business and IT, and the Business KPI dashboard accomplishes this by monitoring your business processes like Order to Cash (O2C) and Procure to Pay (P2P).
The screenshot below highlights the amount and status of each order entered into the system (O2C), Purchase Orders (P2P), and Requisitions.
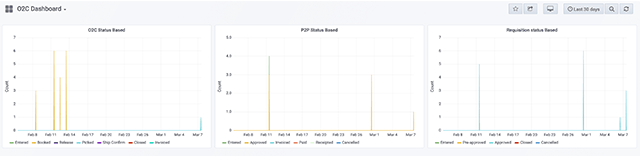
These are standard SQL queries that are going against the orders table or the PO orders, or the requisitions table, and pull all the information from those tables.
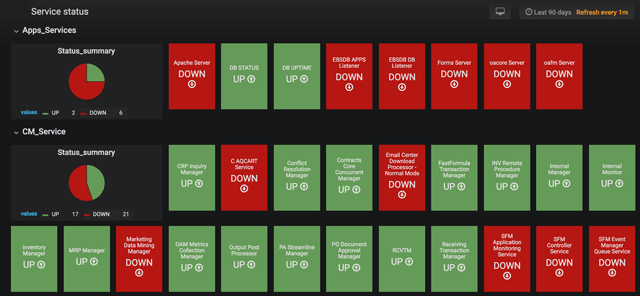
Dashboard Monitor
The Dashboard Monitor inspects each service running in your application and database and shows you what is and isn't up and running, how many patches were applied, the number of application and database patches, the last time auto config was run, scheduled concurrent requests, invalid objects, etc.
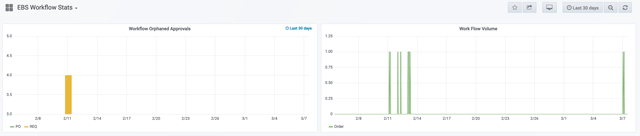
Workflow Stats
The workflow dashboard monitors workflow volume, how many are running in the system, wait time, and number of orphaned records.
Live SQL Tuning Pack
SQL tuning is an ideal way to boost the performance of a process in a system. DBAs and Developers are often tasked with finding the slow performance process, tuning the SQL used by the process, and increasing its performance. In TrendZ, all of these tuning activities can be done from one window.
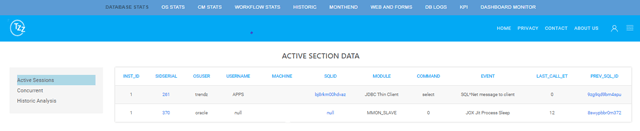
The tuning dashboard consolidates everything into one location like SQL logs, run history, SIDs, and remediation lifecycle. It also provides full detection and RCA isolation to track active sessions running in the live database.
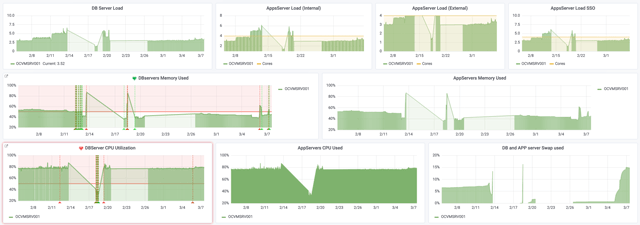
Capacity & Storage Insights
The OS Stats dashboard helps you visualize server health and metrics like load average, memory and CPU utilization, TCP Sockets, and IO, so you can predict future space utilization and plan for resources accordingly.
Oracle EBS R12 Web and Forms
The Web and Forms dashboard displays connection health and performance, the number of external users logged into the system, from where users are logging in, and behavior during work hours, evenings, and weekends. The graphs help you better understand how JVM modules are connected and module mapping shows you which page was run.
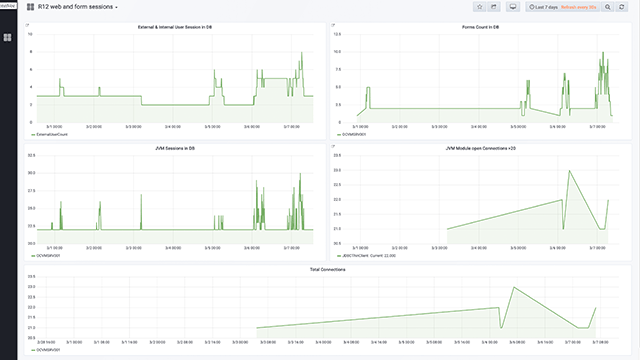
By providing metrics at the WebLogic and application tier level, TrendZ helped one of the largest furniture manufacturers visualize file response time, and the rate at which files were being pushed out, and view the sessions in WebLogic, so they could proactively resolve issues.
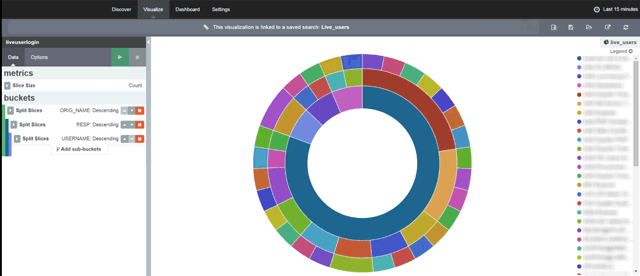
User Activity & Adoption
Initially, we developed this feature for an automobile components manufacturer that had just gone live in 18 countries. They wanted to understand system utilization across each country and identify any countries that were underutilizing the system. Using TrendZ they were able to track daily user activity and active user count and differentiate users based on responsibility (module), operating unit, org, and geography.
This feature helps you make more informed decisions about licensing costs or retiring legacy systems because you can capture utilization based on historic data.
Technology Stack
TrendZ is 100% open source, meaning no additional licensing is required outside of TrendZ itself. Its technology stack is comprised of the following open-source tools:
- Grafana - Data captured in the Influx or any time series database is represented in graphical form using the Grafana platform. Grafana provides visualization options like heat maps, histograms, graphs, and geo maps.
-
Kibana - We use this analytics and visualization platform for drilling down graphs and displaying detailed information.
-
Logstash - Used to read logs and files with information and send data to ElasticSearch.
-
Filebeats - Used to read the data and send it to ElasticSearch or Logstash.
-
ElasticSearch - Used to store the data received from Logstash/Filebeats and send it to Kibana for graphical representation.
-
Tomcat - Used to host the web application developed. The Grafana dashboards are embedded in the HTML pages created in the web application.
-
InfluxDB - Time-bound data is captured in InfluxDB, an open-source, time services database.
Benefits of TrendZ
- The User-friendly interface provides immediate insight to IT teams, business users, and management
- You can monitor any application, database, middleware, and infrastructure component, and it is easy to customize to various servers, instances, and applications.
- Saves time and multiplies IT support effectiveness by automating 70% of your daily issue troubleshooting and maintenance work.
- Lightweight and built entirely using open-source technology
- Helps you become more proactive and prepared for unforeseen events, outages, turnover, etc. by providing real-time and historical information availability.
Benefits by Role
CIO/IT Leadership - TrendZ compiles DBA and IT development analytics into a clear-cut format so management and operations can get a dynamic, real-time health check of their systems from their tablet or phone.
DBA's and SysAdmin's - TrendZ automates many of the tasks performed by DBAs and Admins on a daily basis like identifying error logs, root cause analysis, and performance tuning. This allows DBAs and Admins more time to work on strategic projects and proactive work that reduces outages, and unplanned downtime, and decreases the number of non-DB related requests.
L1 Support Teams - Support teams can improve ITSM quality and reduce the frequency of escalated incidents through proactive monitoring and rapid issue identification.
Apps Admin's - Apps Admin's can rapidly identify and resolve application performance issues and leverage user activity metrics to improve the user experience and control application complexity.
Closing Thoughts
Time, budget, and resource constraints prevent organizations from focusing on IT initiatives that allow them to stay competitive. Organizations can transform how they monitor and manage their enterprise systems by leveraging automation to improve service quality, reduce operational costs, and reinvest time savings toward forward-looking projects.
From management and operations to DBA's and application support teams, TrendZ helps organizations become more proactive and support the business more effectively through automation.